With the rapid development of cities, the concentrated rectification of construction dust, atmospheric dust, road debris, wheel mud, wind and water erosion on unpaved roads, and other problems with multiple, large, and wide areas have seriously affected the effectiveness of air pollution control. In order to further strengthen the scientific and refined management level of urban roads and improve pollution control decisions. Using vehicle monitoring data to analyze special areas (such as national and provincial air quality automatic monitoring stations and other key areas), identify the main pollution sources around sensitive areas, provide data support for targeted governance in key areas, promote data interconnection and joint analysis among multiple departments, especially for the dynamic integration of data from environmental protection, housing and construction, urban management, transportation, and environmental sanitation departments in response to road dust and dust accumulation issues. By utilizing grid based air quality monitoring, pollution source emission monitoring, atmospheric environment super station monitoring, pollution source inventory data, meteorological data, urban management data, and dump truck data, we aim to achieve interconnectivity of environmental big data and enhance the scientific and intelligent level of urban air quality management as a whole.

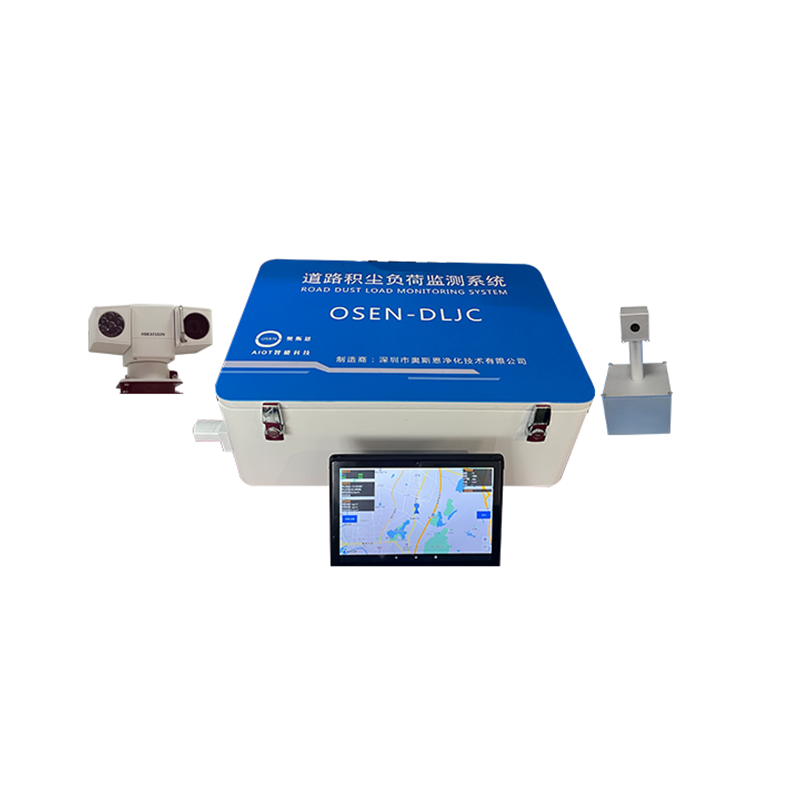
The road dust load navigation monitoring system is an online real-time monitoring system for particulate matter in the atmosphere and dust raised by road vehicles. Transfer the collected data information to the intelligent cloud platform for processing, and provide customers with monitoring information on various aspects including route maps, particle values at points, etc.
Performance characteristics
1. It integrates functions such as protection, measurement, signal, and display.
3. It has multiple protection functions such as short circuit, overload, and low voltage, and various functions can be selected.
3. Adopting advanced industrial grade chips, the bus does not come out of the chip, and the electrical isolation and electromagnetic shielding design comply with relevant standards, so that the hardware system of the device has high anti-interference ability and operational reliability.
4. The principles of detection, collection, and analysis are mature and reliable, and can withstand long-term on-site operational tests.
5. Real time display of dust monitoring at mobile vehicle locations, with no restrictions on monitoring locations.
6. No installation bracket: Suitable for various vehicle models.
7. It can ensure that the normal use of the road dust detector is not affected when the ambient temperature is between -10 ℃ and 40 ℃, the relative humidity is less than or equal to 80%, and the wind speed is below level 4.
When the detector samples, sample a value every 1 second interval.
9. On site inspection data can be exported through platforms and other methods.
10. The detector is equipped with GPS, and the raw data is exported with GPS point information.
11. The data acquisition module controls the operation of the detection equipment and transmits data to the computer system.
12. The working environment of the data acquisition module is -10 ℃ to 50 ℃, with a relative humidity of 5% -95% and no frost.
13. The sampling tube is used to transport dusty airflow to the particulate matter monitoring unit. The length of the tube should be shortened, with an inner diameter of (50 ± 10) mm and a smooth inner surface. When the sampling tube needs to be bent, it should have a smooth transition to avoid sudden changes.
14. Support remote monitoring, detection, and early warning (optional).
15. The sampling port is used to collect suspended particles lifted by the driving force of the vehicle, and its design and material selection require smooth inner walls and anti-static properties.
16. Touchscreen LCD display, user-friendly interface.
17. The software can display data from the detector, real-time vehicle speed, and GPS information.
18. Automatically upload the current sampling data to the computer system after each sampling is completed.
19. Generate navigation chart for standard map display.
After the detector uploads the data to the computer system, the system software automatically organizes and analyzes the data, and generates color annotations on the corresponding roads on the map based on the set concentration standard values. The displayed color is the actual sampling road section, and the concentration of the dust load value corresponds to the corresponding color to distinguish the dust load values of different concentration gradients.
Keyword:


